Organization Dashboard
NAVIGATION Organizations > Organization Dashboard
PERMISSIONS Admin or Billing and Purchasing role
The KaseyaOne Organization Dashboard has three tabs, Security Scorecard, Security, and Service Delivery, where you can see data and pre-generated executive reports for organizations. The tabs that you see depend on the subscriptions you own.
Note the following about the Organization Dashboard:
- Dashboard data is currently read-only.
- KaseyaOne Unified Login must be enabled in all modules to populate the dashboard data.
- It may take up to 24 hours for the data to be synced after you enable KaseyaOne Unified Login for a module.
Overview
To view the Dashboard for an organization, select it from the dropdown list at the top of the page. To search, start typing the name.
NOTE The Dashboard only shows data for modules whose organization name exactly matches the one you select. For example, if you select Clouds Above IT, a module's organization named Clouds Above IT NE will not be included.
The following tabs are currently available in the dashboard:
- Security Scorecard: The Security Scorecard tab provides a clear assessment of security module deployment across endpoints, highlighting coverage gaps in critical areas like antivirus, ransomware detection, and backups to drive targeted remediation and improve overall cyber readiness. Refer to Security Scorecard for more information.
- Security: The Security tab equips you with a unified view of threat protection, vulnerability scanning, risk metrics, and data breach exposure, enabling swift prioritization and remediation of critical security gaps across client environments. Refer to Security for more information.
- Service Delivery: The Service Delivery tab provides a centralized view of client network health, ticketing performance, endpoint protection, and backup reliability — enabling proactive issue resolution and measurable service value. Refer to Service Delivery for more information.
Security Scorecard
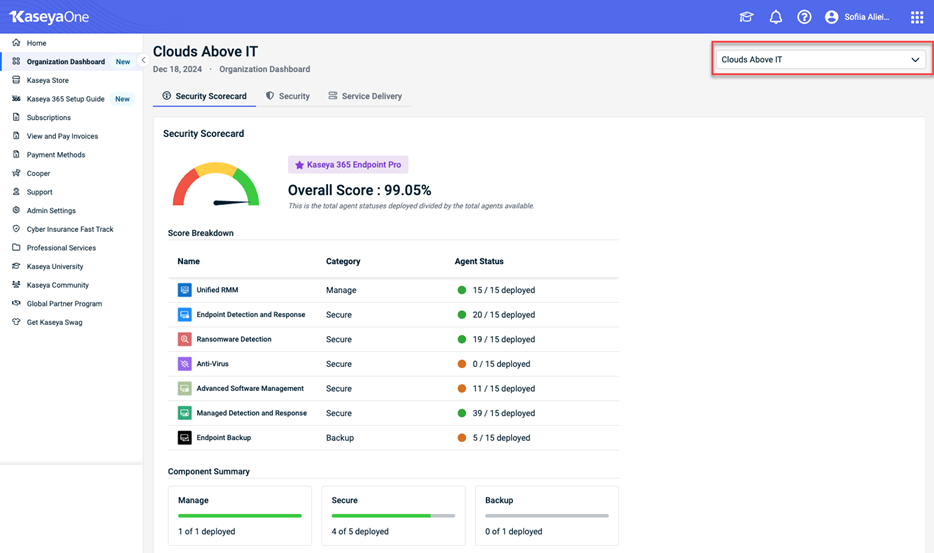
The purpose of the Security Scorecard is to track the level of protection provided for a specific organization. It shows how many endpoints out of a total number of endpoints deployed are covered. The overall score is an average of all Agent Statuses in the list.
Each row in the scorecard corresponds to a security function, broken down into three parts:
| Column | Description |
|---|---|
| Name | The feature/function being tracked (e.g., Ransomware Detection, Anti-Virus) |
| Category | Whether it falls under Manage, Secure, or Backup |
| Agent Status | Shows the number of agents deployed versus available (e.g., 43/101) |
NOTE At this time, Advanced Software Management agents status for Datto RMM and all agent statuses for VSA 9 will display Coming soon.
The following table outlines the metric for each function:
| Function | Modules | Metric Description |
|---|---|---|
| Unified RMM | VSA 10, Datto RMM | Tracks the number of laptops, desktops, and servers reporting into the RMM module; also identifies devices with active agents. |
| Advanced Software Management | VSA 10 | Identifies devices that have patch management enabled and receiving updates. |
| Endpoint Detection & Response | Datto EDR | Measures how many devices report active daily endpoint protection activity. |
| Ransomware Detection | Datto EDR | Counts the number of devices with active ransomware detection enabled. |
| Anti-Virus | VSA 10, Datto RMM, Datto AV |
Depending on the subscription you have:
|
| Managed Detection & Response (MDR) | Kaseya MDR, RocketCyber | Counts the number of endpoints protected with MDR agent for threat hunting and response. |
| Endpoint Backup | Datto Endpoint Backup | Tracks how many endpoints have a backup agent deployed and reporting status (success, fail, or paused). |
How the score is calculated
The Overall Score (%) is calculated by dividing the total number of successfully deployed agents by the total available agents across the included security functions.
Formula
Overall Score = (Total Deployed Agents / Total Available Agents) x 100.
NOTE Total available agents is reported by RMM, so an active subscription to Datto RMM, VSA 10, or Kaseya 365 Endpoint is required.
EXAMPLE If you have 101 available devices, and only 43 of them have ransomware detection installed, this will negatively affect the score for that specific category and the overall rating. The Overall Score will be: 43 / 101 × 100= 42.57%.
Security
The goal of the Security tab is to summarize Security (user protection, endpoint protection, vulnerabilities, network security) for your organizations in graphical easy-to-read format.
Security reports are currently available for the following:
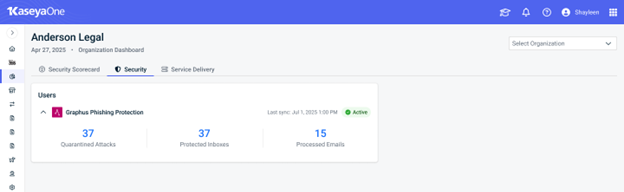
Graphus Phishing Protection
This widget provides a quick-glance view of phishing protection effectiveness and reach within the selected organization.
| Quarantined Attacks | The number of phishing or malicious email attempts that were automatically identified and quarantined by Graphus, preventing them from reaching user inboxes. |
| Protected Inboxes | Total number of email inboxes currently under active protection by Graphus in this organization. These are the mailboxes being scanned and defended. |
| Processed Emails | The number of emails that have been scanned and analyzed by Graphus during the current reporting period (up to the latest sync). |
VulScan Vulnerability Scan
This widget provides a summary of vulnerability scan results, including total issues detected and their severity breakdown –Critical, High, Medium, Low. It helps you quickly identify and prioritize remediation efforts based on the latest scan data, all from a centralized view.The VulScan widget also allows you to monitor security metrics alongside other organizational KPIs, enabling faster decision-making and improved threat awareness.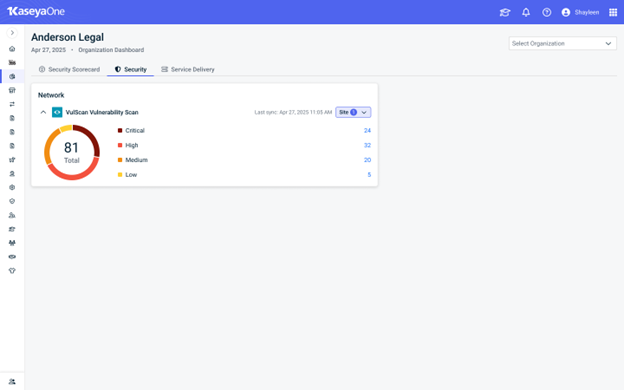
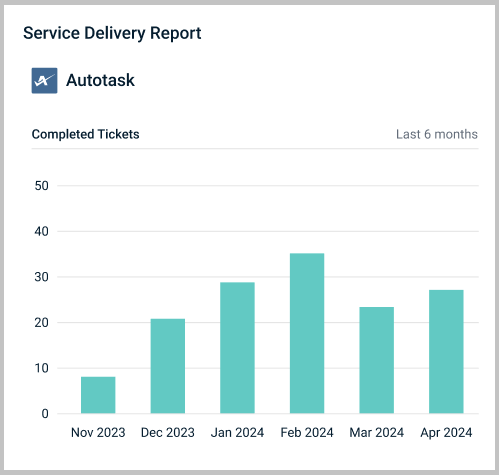
Service Delivery
The Service Delivery tab summarizes and displays Service Delivery (ticketing, network, user, and endpoint) data for your KaseyaOne instance in graphical format, presenting it in a combination of easy to-read report formats (charts, gauges, and tables). 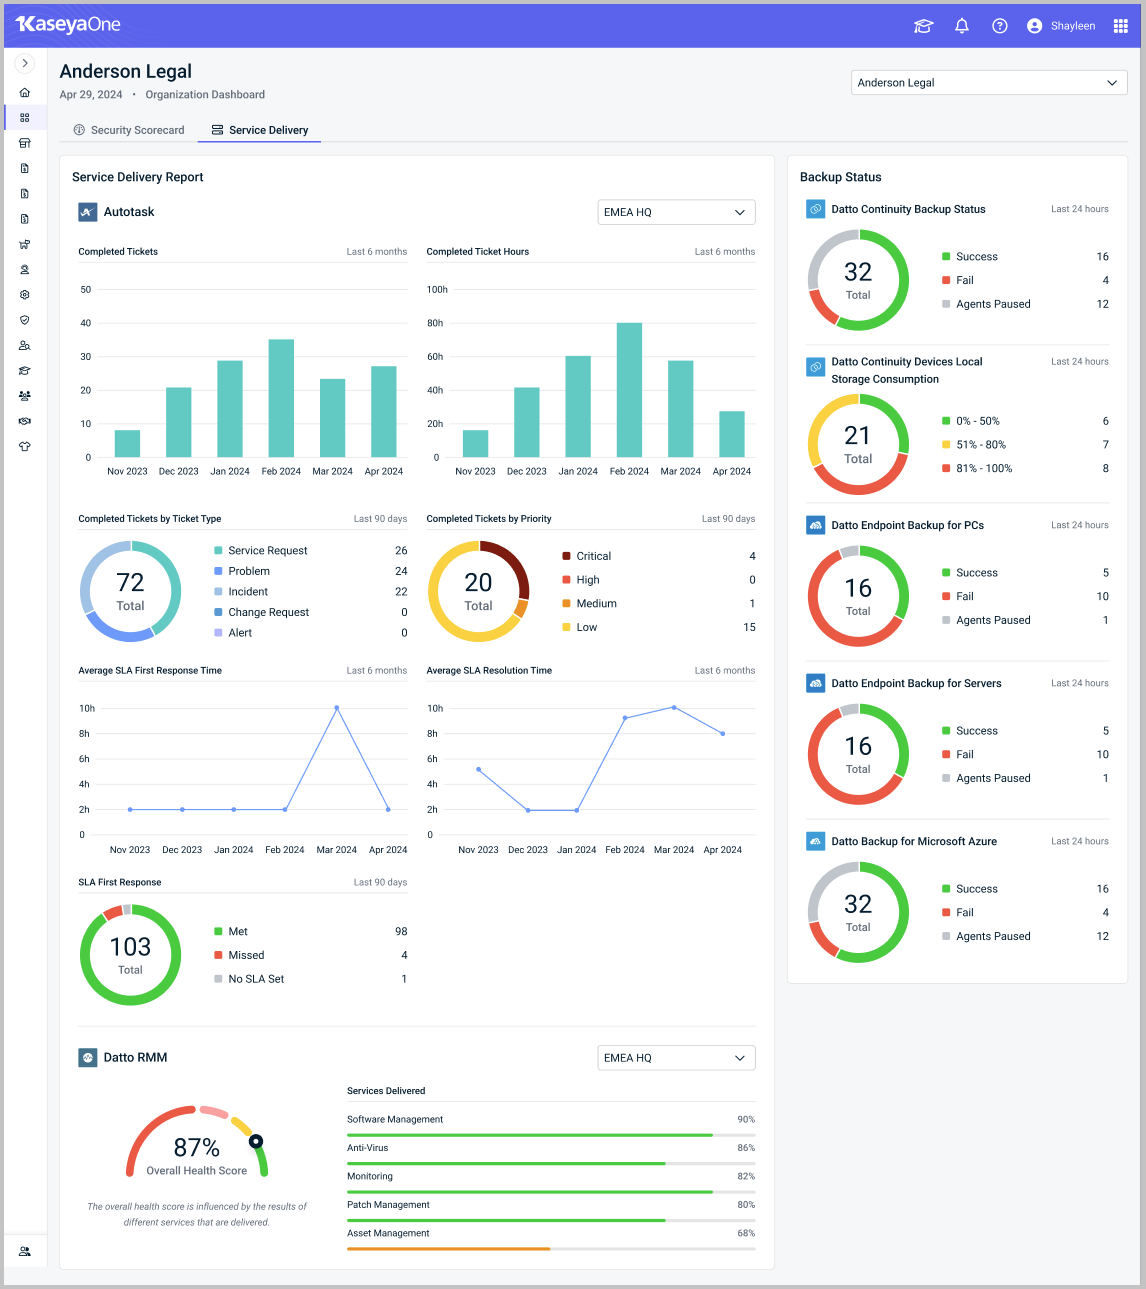
Service Delivery reports are currently available for the following:
The reported data for these modules gives an overall picture of how efficient your organization is processing tickets.
Reports the following (Autotask or BMS) ticket data for the selected site:
- The number of Completed Tickets in the last 6 months
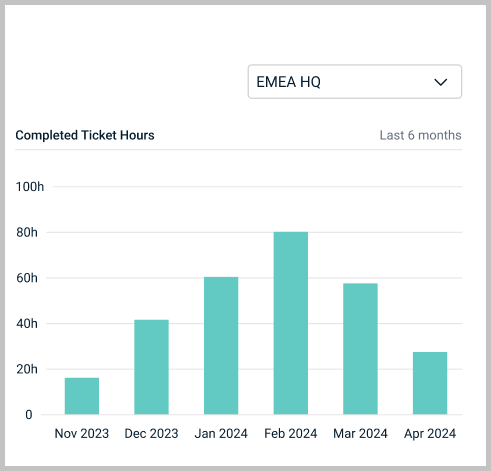
- The number of Completed Ticket Hours in the last 6 months
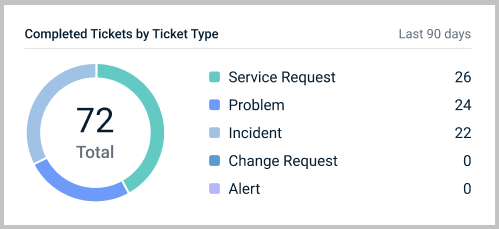
- The number of Completed Tickets by Ticket Type (Service Request, Problem, Incident, Change Response, Alert) in the last 90 days
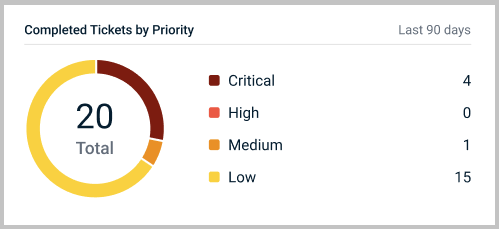
- The number of Completed Tickets by Priority (Critical, High, Medium, Low) in the last 90 days
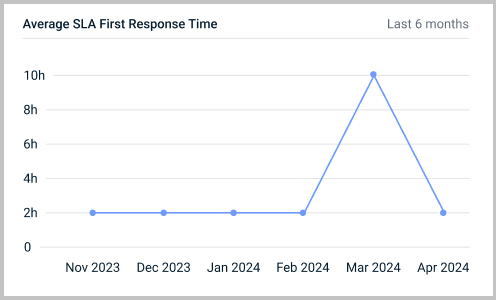
- The Average SLA First Response Time for tickets in the last 6 months
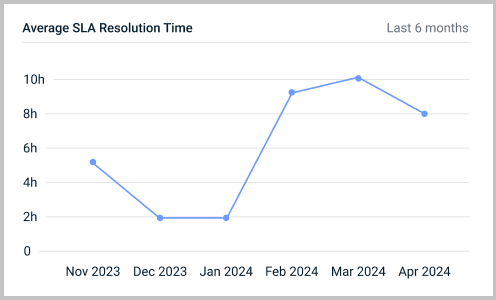
- The Average SLA Resolution Time for tickets in the last 6 months
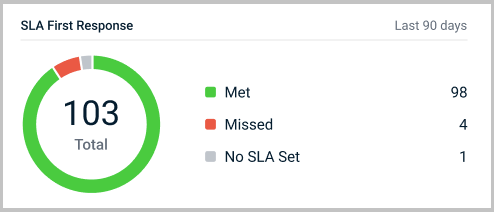
- The number of SLA First Response tickets (Met, Missed, or with No SLA Set) in the last 90 days
Reports the Overall Health Score for the selected site in the last 24 hours.
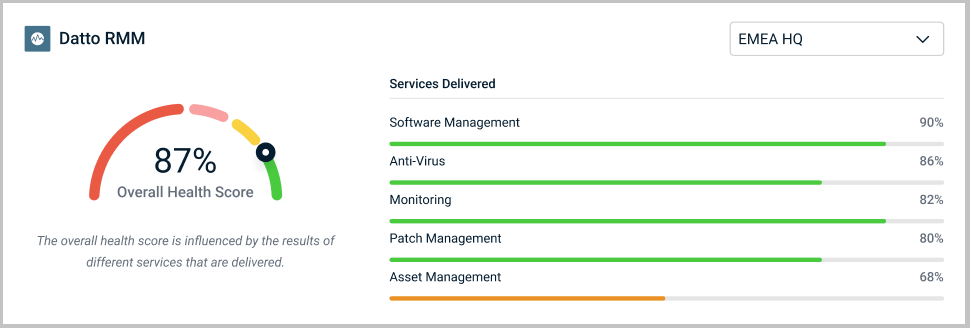
The reported data for Datto RMM gives a Services Delivered score for a range of different services, which in turn influences the Overall Health Score. The services are:
- Software Management. This data helps ensure that all software updates are installed.
- Anti-Virus. This data helps ensure that anti-virus software or solutions are up to date so that you can alert users of any issues.
- Monitoring. This data helps ensure that potential problems are fixed before they become larger issues.
- Patch Management. This data helps ensure that all devices are kept up to date.
- Asset Management. This data helps ensure that users get any potential upgrade they need.
Reports the agent backup status data for the last 24 hours according to Success, Fail, and Agents Paused.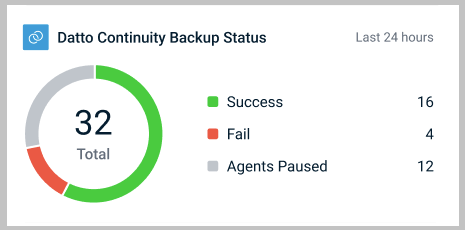
The reported data gives visibility into backup status, ensuring the continuous protection of critical data.
Reports the device storage consumption data for the last 24 hours according to the following percent ranges: 0-64%, 65-75%, and 76-100%.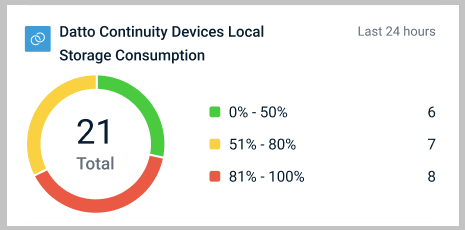
The reported data highlights and helps you to understand how local storage is utilized across devices, allowing for efficient resource management.
Reports the agent backup status data for the last 24 hours according to Success, Fail, and Agents Paused.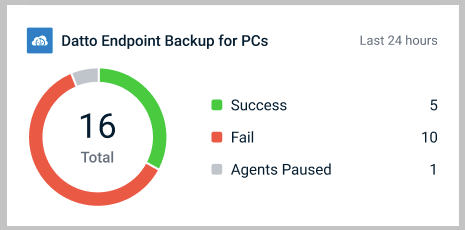
The reported data helps you track the backup health of your PC endpoints, ensuring that crucial data is securely backed up for quick recovery.
Reports the agent backup status data for the last 24 hours according to Success, Fail, and Agents Paused.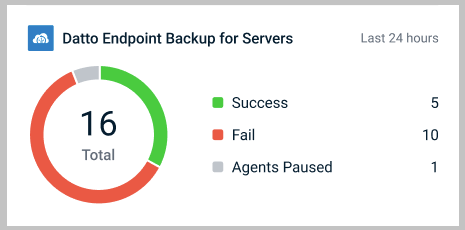
The reported data helps you monitor the backup status of your servers, ensuring continuous data protection and minimizing downtime.
Reports the agent backup status data for the last 24 hours according to Success, Fail, and Agents Paused.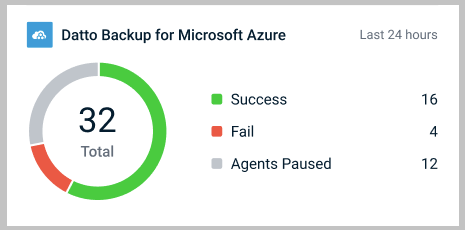
The reported data helps you gain insight into the health of your Microsoft Azure backups, ensuring the integrity and availability of your cloud-based data.
If data cannot be displayed in a module widget, one of the following statuses may be displayed:
Module not connected to KaseyaOne
KaseyaOne Unified Login has not yet been enabled. Click Enable Unified Login.
Refer to Enable Log In with KaseyaOne.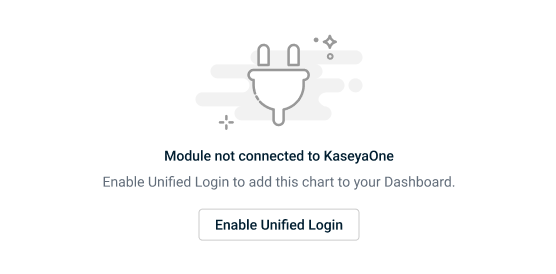
Sync in progress...
KaseyaOne Unified Login was enabled less than 24 hours ago, and the data sync is still in progress.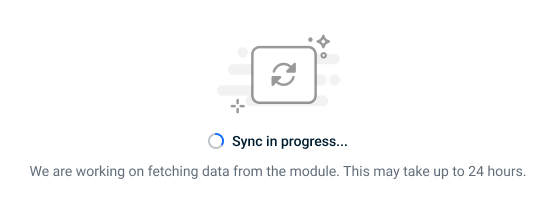
No such Organization in this module
The target organization does not exist in the specified module and must be created.
Oops! Something went wrong
A technical issue has occurred. Attempt to fix the issue by reloading the web page. Refer to Kaseya Helpdesk for additional support.
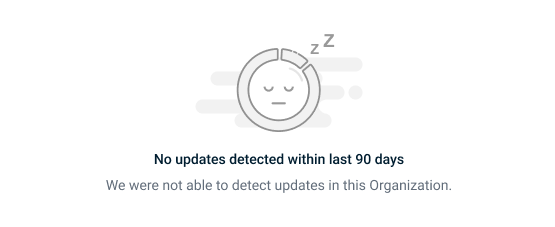
No updates detected within last 90 days
Although the organization has a tenant, no account activity has been detected for 90 or more days.
Data will appear up to 24 hours after performing account activity.