Invoice Comparison Tool
NAVIGATION Home > Subscriptions & Billing > Compare Invoices
PERMISSIONS Admin or Billing and Purchasing role
The Invoice Comparison Tool is an AI-powered feature built from customer feedback to help you quickly analyze and compare invoices. It provides instant, easy-to-understand insights into your billing data, enabling you to identify trends, verify charges, and make informed business decisions—all within your KaseyaOne portal.
Key features
Key features include:
-
Automatic data retrieval: Select the time frames you want to compare and the tool automatically pulls all invoice data.
-
Manual upload option: Upload Excel files for custom comparisons.
-
Unified view: Whether data is pulled automatically or uploaded manually, insights display in the same easy-to-navigate interface.
-
Insight tabs: Insight data is presented on these tabs: Overview, Organization analysis, License & storage changes, Device allocation & changes, and Renewals. The information presented on each tab is described below.
Use these features to gain immediate visibility into billing activity.
Accessing the Invoice Comparison Tool
Users with the Admin or Billing and Purchasing role can access the Invoice Comparison Tool by selecting Compare Invoices under Subscriptions & Billing in the left navigation menu: 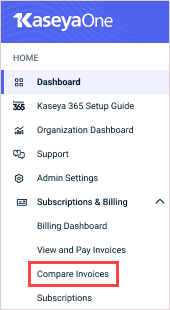
Selecting invoices to compare
To compare invoice data, simply select the customer currency and invoices to compare, using either of the following methods:
-
Automatic data retrieval: Compare invoices from two different months by selecting the months in the Month 1 and Month 2 lists and clicking Compare. All invoices (of the selected currency) from each month are automatically pulled and analyzed.
-
Manual upload option: Compare specific invoices by manually uploading Excel exports of invoices from two different months. Export the invoices to Excel as described in View and download invoices. Then under Compare Invoices in the left navigation pane, click Upload. In the field at the top of the Upload invoices page, drop or browse to the Excel exports. Uploaded invoices are analyzed.
Invoice comparison data populates the tabs on the page. See the topics that follow for descriptions of the insights displayed on each tab.
Overview tab
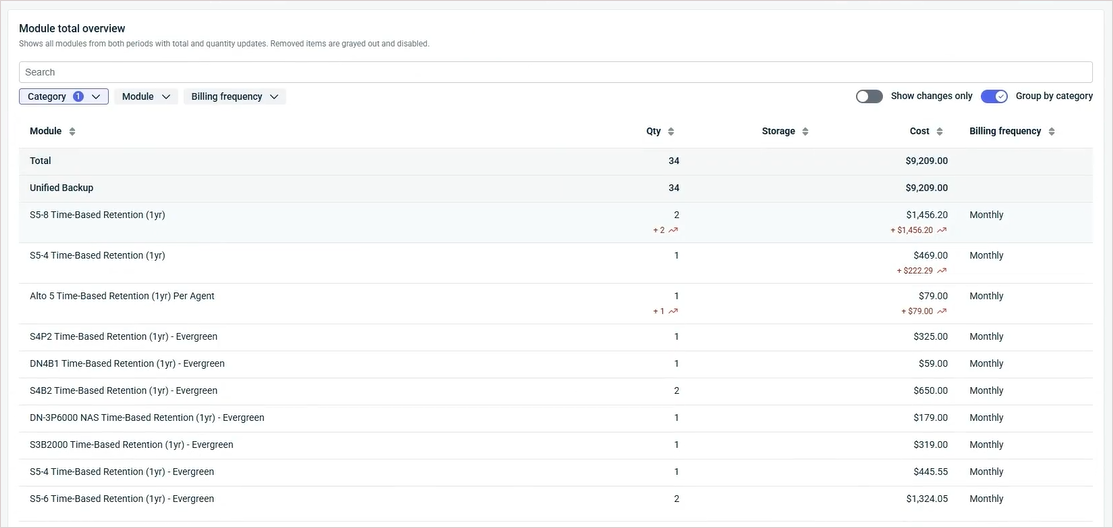
The Overview tab provides a high-level summary of total cost changes between invoice periods, highlighting which product categories are driving those differences.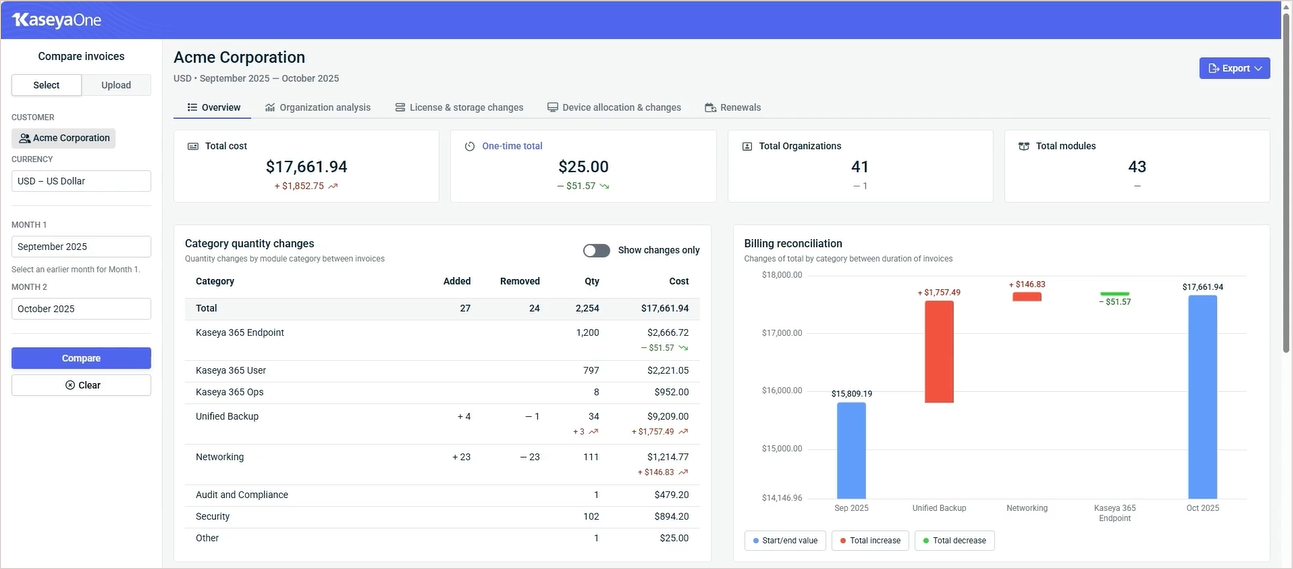
In the Category quantity changes table, you can click into any category to explore the detailed charges and quantity changes that contributed to those cost shifts. In this example, we've turned on the Show changes only toggle and selected the Unified Backup category to view its detailed charges: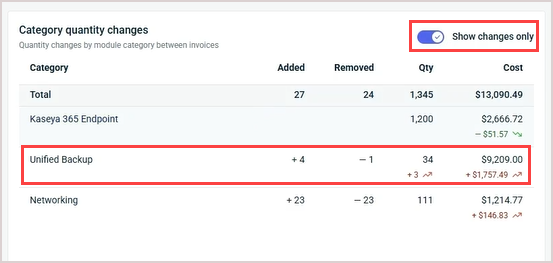
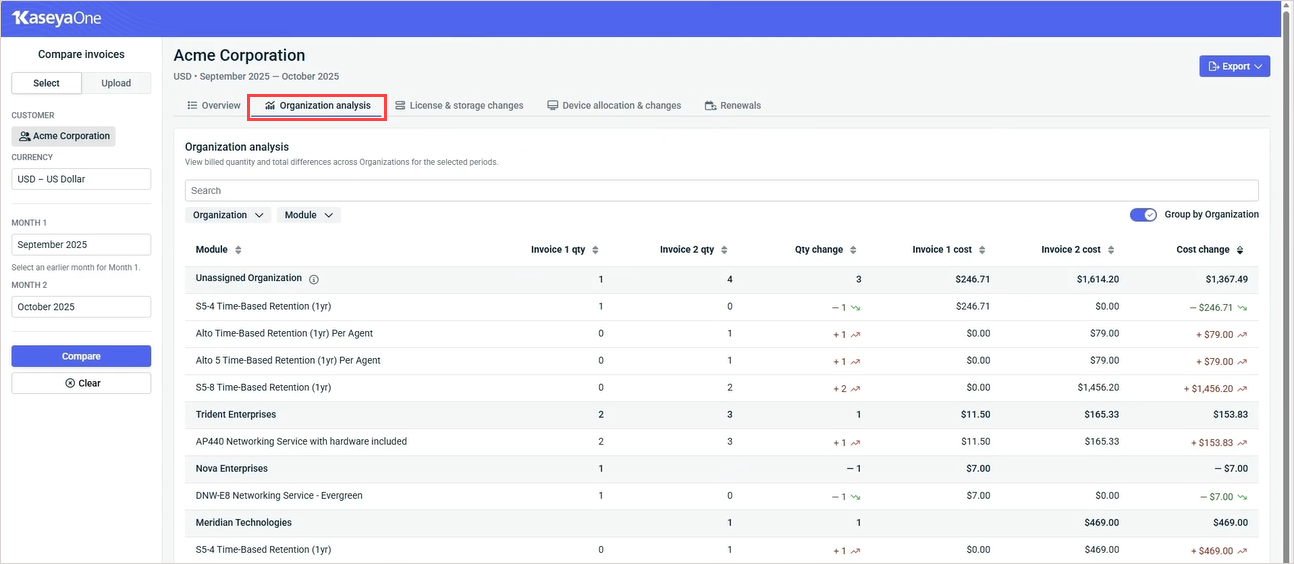
Organization analysis tab
IMPORTANT The Organization analysis tab applies only to products whose invoices report usage by end-client organization. This includes the following products: Datto Backup for Microsoft Azure, Datto BCDR, Datto Endpoint Backup for PCs, Datto Endpoint Backup with Disaster Recovery, Datto Networking, and Datto SaaS Protection. Invoices for other Kaseya products do not report usage by end-client organization and are not included in the data on this tab.
The Organization analysis tab shows which end-client organization the billing changes are associated with and which product quantity adjustments led to those differences. Data for any product that does not have an assigned organization or customer name displays under the Unassigned Organization heading.
If an organization does not display, there were no cost changes in the selected invoice periods (for the supported products listed above).
Quickly filter the data that displays by one or more organizations or modules as shown here: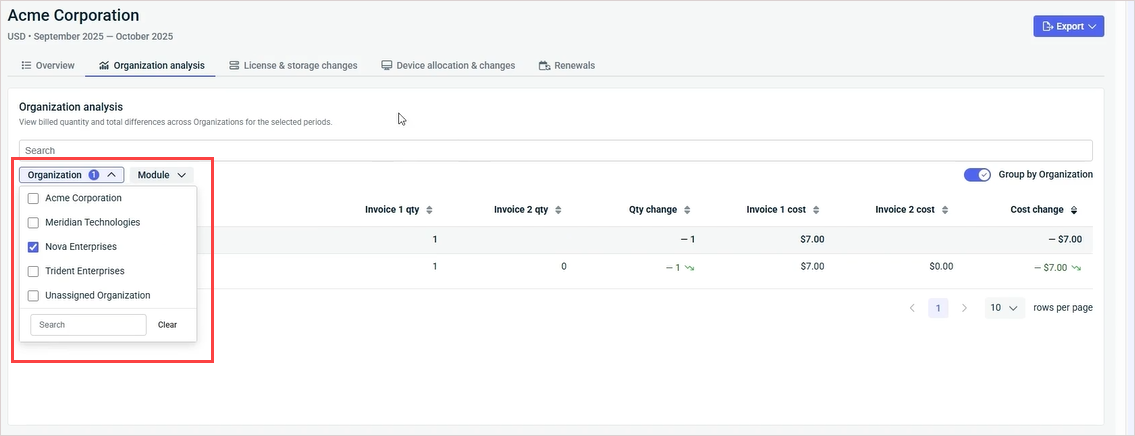
License & storage changes tab
The License & storage changes tab gives you a quick view of how license counts and storage usage changed month over month. This tab includes data only for products where license quantity or storage usage apply.
The License tab shows organizations where the product's license quantity has changed for the selected invoice periods. The Storage tab shows organizations where the product's storage usage has changed for the selected invoice periods. If an organization does not display on a tab, its license or storage usage has not changed for the selected invoice periods.
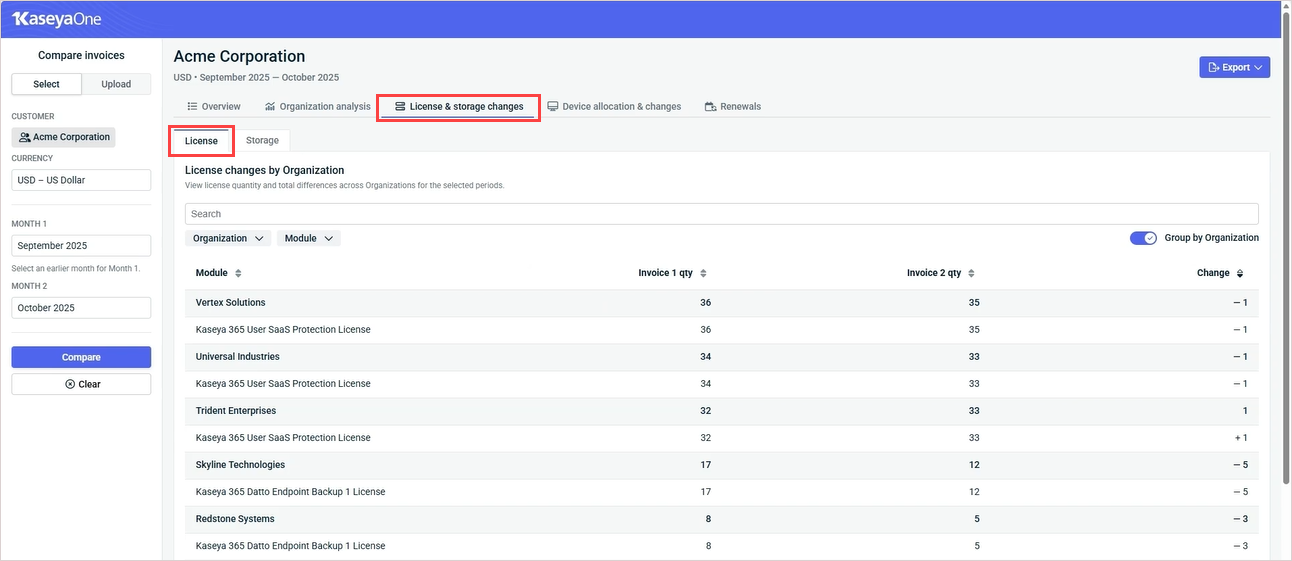
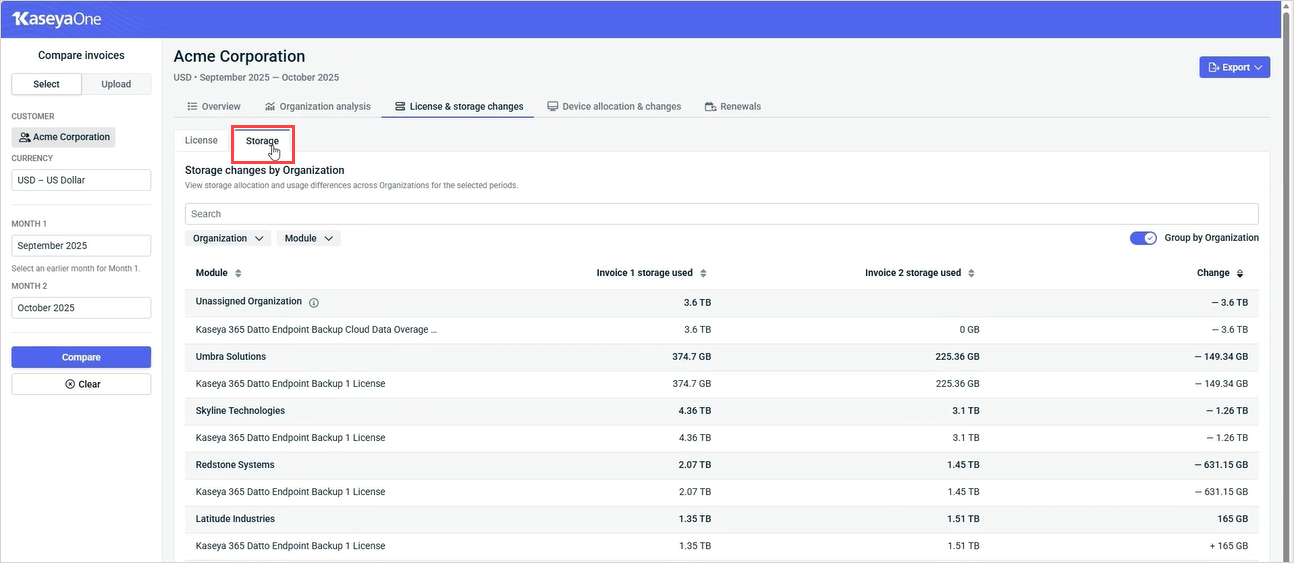
You can use filters to focus on a single organization or module, or compare multiple at once.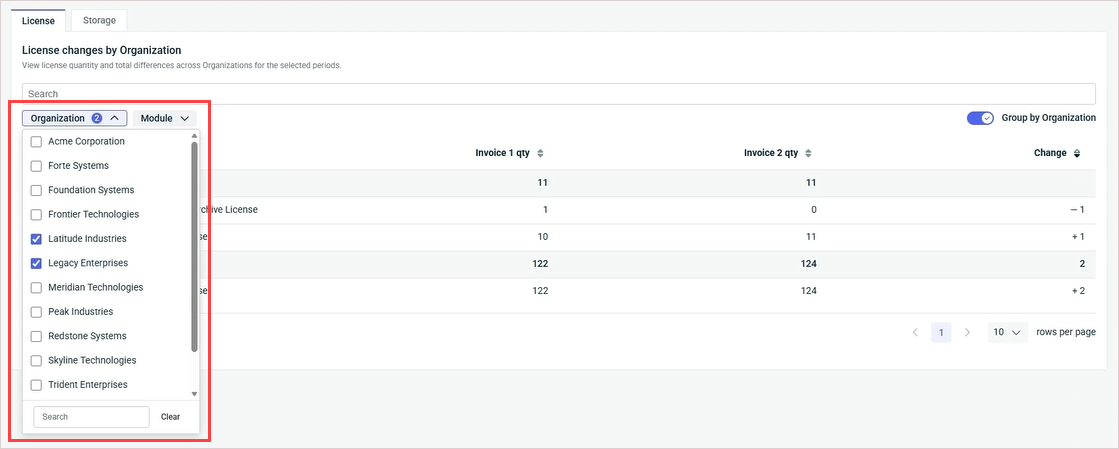
Device allocation & changes tab
The Device allocation & changes tab aggregates all device identifiers in your invoices and maps them to their respective end-user organizations, helping you easily see which devices are tied to which clients. This tab includes data only for products that have devices.
The tiles at the top of this tab show total device change (net change in number of devices), devices added, and devices removed.
The Device changes by Module chart shows added and removed devices by module.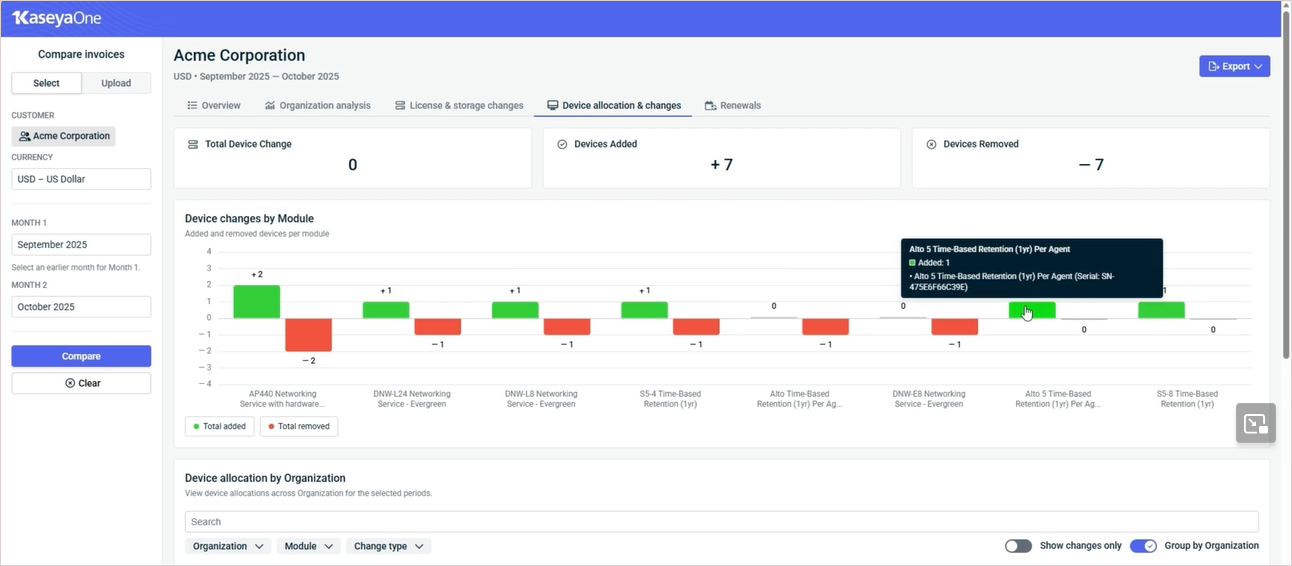
The Device allocation by Organization table shows the devices allocated to each organization for the selected invoice periods. You can quickly filter the data that displays by selecting a change type or one or more organizations or modules. You can opt to view only devices that have changed by turning on the Show changes only toggle. Click the arrows next to a column heading to reorder the display.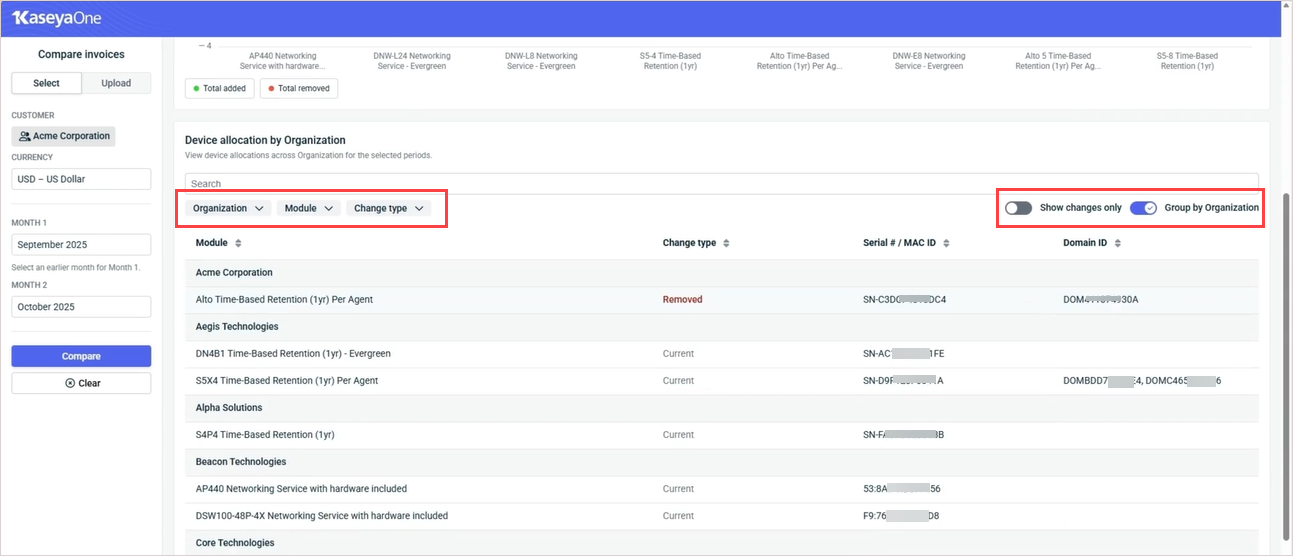
Renewals tab
The Renewals tab lists upcoming renewal dates by quote number.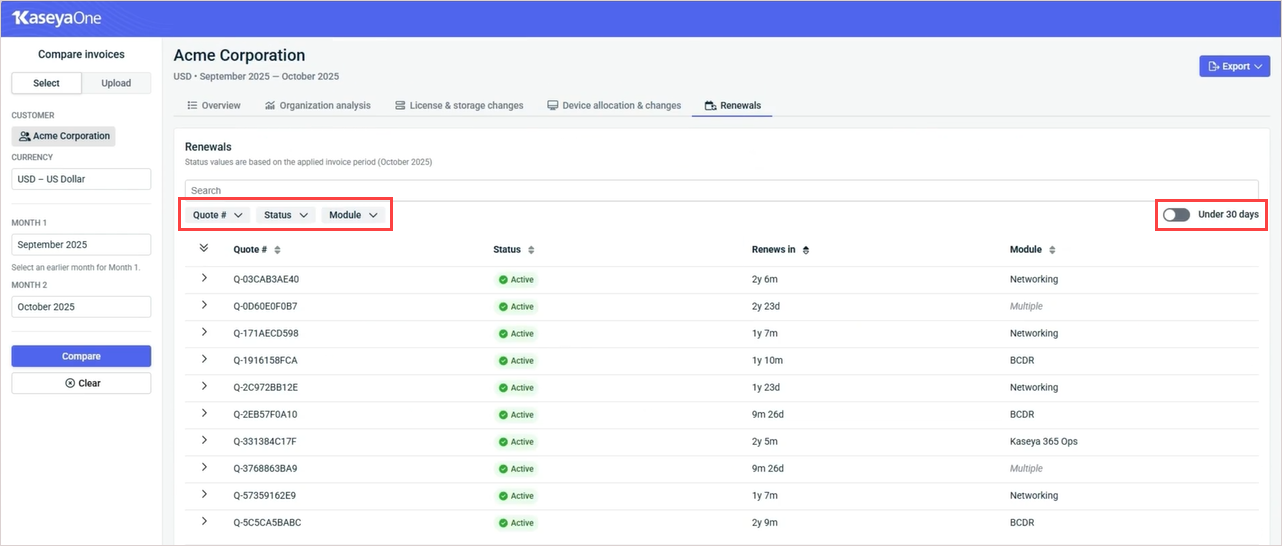
-
Click a quote in the list to view its organization and other product details.
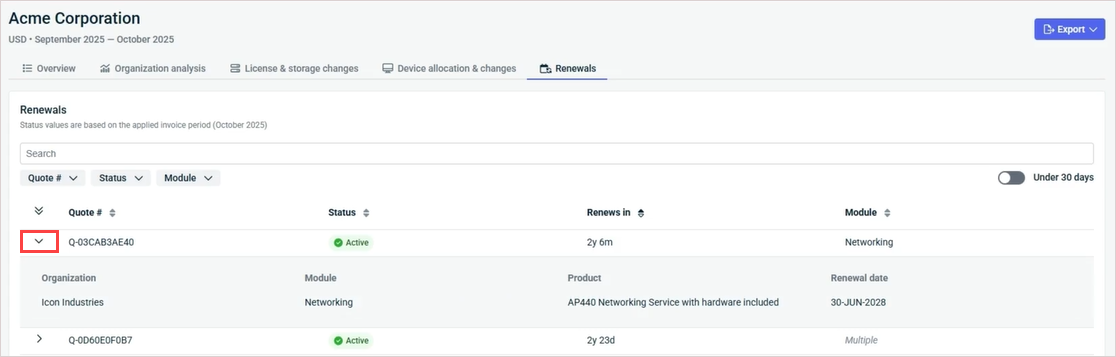
-
Reorder the display by clicking the arrows next to a column heading.
-
Filter the list by quote number, status, or product module. Status values are based on the applied invoice period (the date of the later invoice being compared).
-
Turn on the Under 30 days toggle to display only the renewals that will occur in less than 30 days.
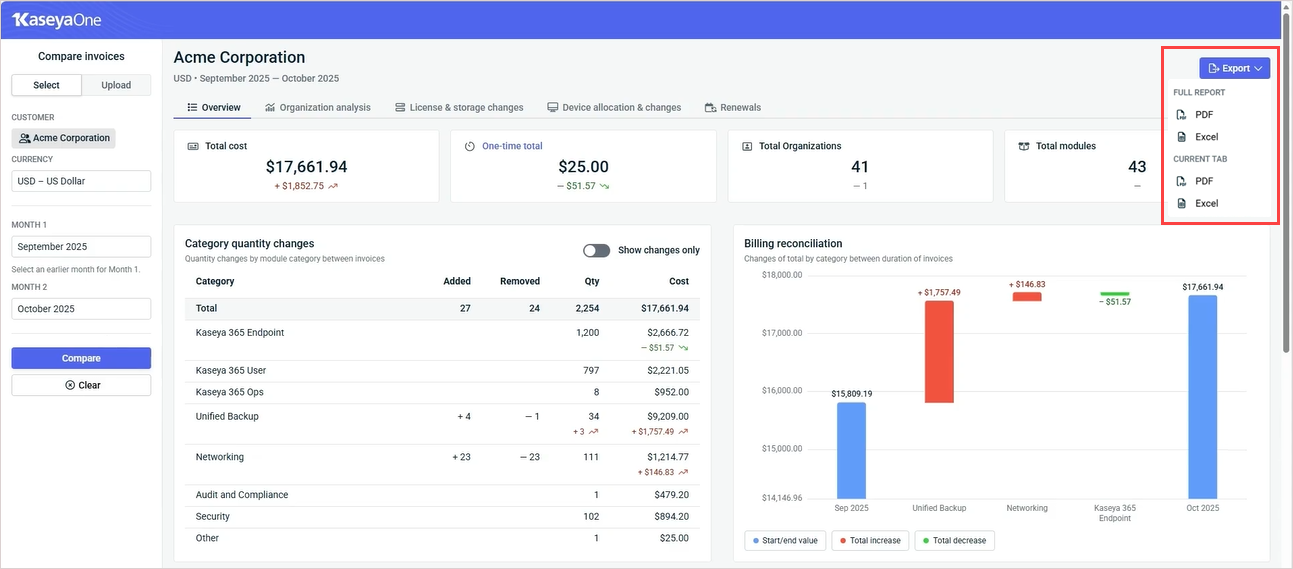
Exporting insight data
While viewing data on any of the invoice comparison tabs, click Export in the upper-right corner to download reports in PDF or Excel format. Choose to download the full report or a report of the current tab only.